
Recently, we surveyed the changes to the landscape of marketing key performance indicators (KPIs). The big takeaway: Vanity metrics are OUT, and engagement metrics are IN. Now, let’s look at the strategy and tactical execution for improving your engagement KPIs.
The Role of Audience Selection in Improving Engagement
Our emphasis on historic metrics such as pageviews, bounce rates, impressions, and open rates brought many B2B veterinary marketers to the conclusion that more is better. More emails on the send list, more impressions on the banner ad, more traffic to the website, and more impressions on our social ads. We went big, but times have changed.
As the conversation shifts from volume to engagement metrics, our strategy shifts, too. Now, we aim for higher click rates, longer website visits, and more likes and comments on social posts.
Great engagement takes work, but it’s well worth the effort. It requires a deep understanding of your audience and implementing a more refined marketing engine to reach targets on the right channels at the right times. Here are 3 guiding principles.
1. Skip the lists for sale.
There is a common misconception that adding more to the database will result in better results.
That’s the old way of thinking.
If you want to drive engagement, purchasing lists of completely cold contacts is one of the worst things you can do.
There are many reasons to avoid buying email lists, but from a KPI perspective, engagement is reason #1. Purchased lists earn meager click rates (commonly under 1%), driven by poor open rates (around 2%-4%).
In addition to receiving poor engagement, these lists can increase your CRM and email marketing costs.
2. Target the audience and the message.
Which gets more clicks:
- A generic message to a mixed audience of 45,000 veterinary professionals
- A focused message to 10,000 veterinarians who recently engaged with content on cliniciansbrief.com about atopic dermatitis
If you guessed #2, you’re absolutely right.
When you know who you are talking to, you can target your message to the right audience, which boosts your engagement metrics.
Leverage your internal data alongside trusted partner data to determine the content your audience wants to see.
Time spent on a page and landing page conversion metrics will point you to the content that resonates with your audience.
For example, one advertiser evaluated the performance of a mix of deployed content, including some focused on dogs, some on general awareness, and some on cats. These insights revealed that cat content ruled the clicks. From there, they used the information to craft a campaign that earned a 4% boost in social engagement.
3. Focus on quality, not quantity.
More emails in the inbox does not equal more engagement. However, it can lead to more unsubscribes, so use email strategically. Remember that the cornerstone of achieving engagement is consistently delivering relevant, timely, high-quality content for your audience.
As a B2B veterinary marketer, you know content is king. Aligning sponsored content with respected industry leaders like Clinician’s Brief can boost your engagement significantly.
Clinician’s Brief’s native newsletter ads get the clicks. When designed as a native placement alongside the high-authority content of the Clinician’s Brief Daily Newsletter, native newsletter ads get a 7.6x higher click-through rate than banner ads.
We evaluated the performance of 16 native newsletter ads across several brands, and the results were impressive:
- $23.86 Average Cost Per Lead (CPL)
- $8.38 CPL on the top-performing ad
- These were a mix of MQLs and SQLs
Social media is the only other channel that comes close to these low CPLs. However, social leads are typically higher in volume and lower in quality. Also, social isn’t ideal for long-format content lead generation. For content such as webinars and longer pieces, native spots have been shown to drive lead conversions and make up the majority of the 16 ads we analyzed in the example above.
To achieve a CPL of $8.38 with a competitive ad unit, you must generate 480-1,080 leads per ad, which is rare. So, why don’t more marketers go with the ad that delivers better results?
Native content spots are often overlooked for one main reason—they’re not branded. Old-school thinking tells us that unbranded content isn’t moving the brand forward.
With native ads, this may look true on the surface, but what it’s doing that is highly valuable is garnering engagement from people with a genuine interest in the content. The result is more clicks and more conversions. So, it’s important to remember that just because an ad unit is small or doesn’t include a company’s logo doesn’t mean it won’t succeed in hitting a high CPL.
Evaluating and Improving Engagement Performance
Now that we’re aligned on engagement, let’s look at the metrics to focus on.
Cost Per Lead (CPL)
CPL is the best metric for leveling the playing field and comparing apples-to-apples performance across campaigns, media partnerships, and promotional channels.
To establish a target CPL, start with established definitions for MQLs and SQLs. Then, align strategically on which type of leads your campaign seeks to attract.
Depending on your product category, MQLs will cost $10-$50 per conversion, and SQLs often cost $75-$200. Higher-cost products like capital equipment usually have a higher CPL, while lower-cost or subscription-based products have a lower CPL.
Landing Page Conversion Rates
This metric tracks who visited your landing page and submitted a form. One of the best ways to reduce CPL is to improve conversion rates from your landing page.
Here are a few tips for improving landing page performance:
- Mobile experience matters! Test on mobile to ensure it’s a good one.
- The fewer questions, the better! Long forms can deter conversions, so be selective in what you ask first.
- A/B test landing page layouts and language.
- Don’t include anything extra! Keep the focus on conversion.
Companies in the animal health space can experience highly variable landing page conversion rates. They can range from 3% up to 30%, depending on the content, traffic volume, and quality of the page.
Set internal benchmarks for landing page conversions and actively monitor your landing page for engagement insights.
Social Ad Engagement
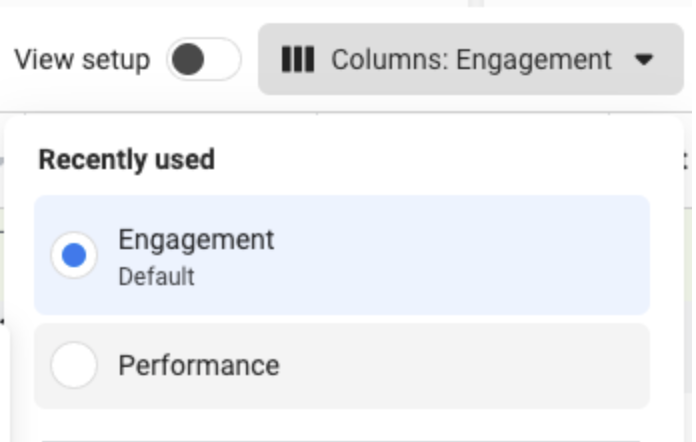
When you visit Ads Manager, the default performance metric view shows Meta’s “performance” columns. These columns show information such as reach, impressions, ad spend, and cost per result.
Don’t forget to toggle the report view to review the “engagement” columns. These columns show total post engagement, comments, saves, shares, reactions, clicks, and follows or likes.
Email Click Rate
We’ll always look at open rates, but the click rate is the metric to hang our hat on. We took the in-house email performance from several B2B veterinary companies, compared them to Clinician’s Brief email performance, and here’s what we found:
- In-house average email open rate: 21.5%
- In-house average click rate: 1.8%
- Clinician’s Brief average email open rate: 43.6%
- Clinician’s Brief average click rate: 1.59%
Clearly, Clinician’s Brief gave advertisers significantly higher visibility with 103% higher open rates on average than internal emails. The click rate was on par across both channels. This data reflects an average performance across multiple advertisers, both broad and targeted. An exclusively targeted message to a tailored audience shows even better performance.
Partner with VetMedux to Increase Your Engagement
Tap into our highly engaged audience of veterinary professionals for your future campaigns. Our team can help you align your content with our clinical authority to produce outstanding outcomes. Leverage the decades of VetMedux data to discover (and speak to) your ideal audience.